
I enjoy participating in the bridge-dev mailing list. There are a lot of cool ideas and discussions happening about building software for bridge. Recently, another group member reached out with questions about Bridgebots. They wanted to know if it would be possible to create a Comma Separated Values (CSV) report of LIN files for easier search and analysis of records. This seemed like a great way to build upon the work I’ve already done to support LIN and PBN parsing, so I started building. The result is the first release of the bridgebots_tools package. For now the CSV report is the only tool, but I hope to add more in the future.
Getting Started
The tools package will contain mostly useful scripts and/or command-line utilities. This means there are a couple ways it can be used. For basic usage, I would recommend installing the package with pip install bridgebots_tools and then executing it as a module with python -m bridgebots_tools.csv_report. If you want to edit the script (to add or remove output fields, for example) then you may prefer to download the source from github. The dependencies for the script (bridgebots core and click) can be installed manually or with poetry install.
Report!
The csv_report tool takes in a bridge record file (PBN or LIN format) or directory of files and creates a report CSV. There are several input and output configuration options, and you can read all about them in the Readme. Here are a couple examples of how to run the report. Let’s say we’re interested in analyzing the 2019 Spingold Final. We can start by analyzing a single segment. You can find the download link by searching for “spingold” in the BBO vugraph archive. For simplicity I have also uploaded all the examples to a public google drive folder.
1
python -m bridgebots_tools.csv_report bridgebots_tools_example/64787.lin bridgebots_tools_example/64787.csv
The team results CSV can be viewed on google sheets.
Now let’s analyze all the segments of the finals, and list the boards in individual format (one row per board instead of one row per board pair).
1
python -m bridgebots_tools.csv_report --output_format=individual bridgebots_tools_example/ bridgebots_tools_example/spingold_finals_all.csv
All 120 boards can now be analyzed. Check out the results on google sheets.
Analysis
Now that the data has been exported to CSV, there a variety of ways we could continue our analysis. We could import the data to a tool like pandas, or we could filter, aggregate, and graph the data inside of excel or sheets. Here are some examples of what you might try:
A histogram of the HCP held by whoever opened the bidding: 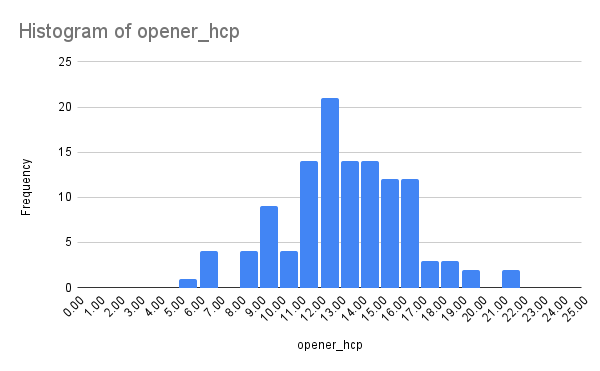
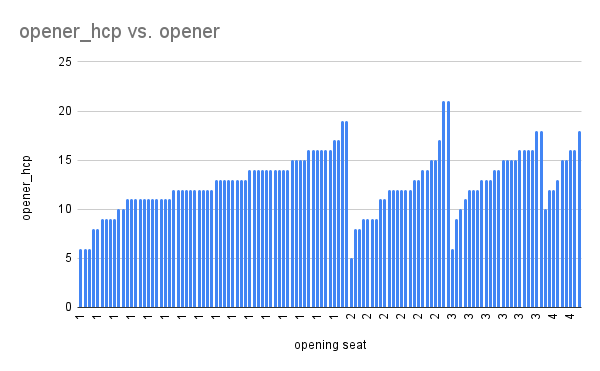
The relationship between opening HCP and opening seat:
The relationship between opening HCP and the final score for opener: 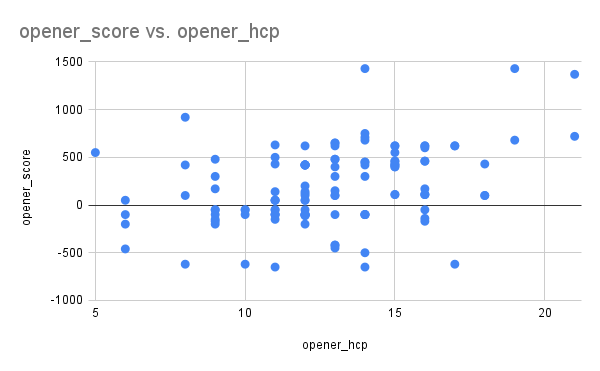
Building a Toolbox
It was fun to build a tool on top of Bridgebots to help meet the analysis goals of other bridge players. In the future, I would like to expand the toolbox to include features like automated BBO history downloads and Double Dummy Analysis. If you have ideas for improvements or new tools to build, please reach out!